> ## Documentation Index
> Fetch the complete documentation index at: https://axiom-mano-sample-app.mintlify.site/llms.txt
> Use this file to discover all available pages before exploring further.
# Monitor list
> This section explains how to create monitor list dashboard elements and add them to your dashboard.
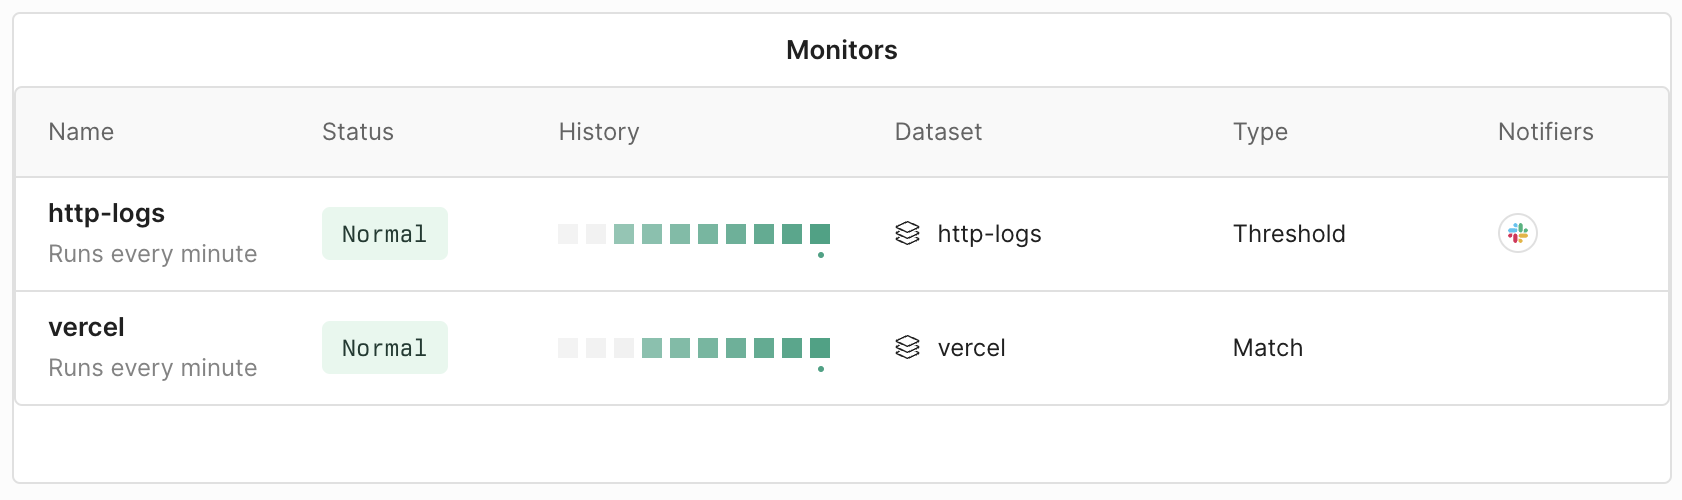
The monitor list dashboard element provides a visual overview of the monitors you specify. It offers a quick glance into important developments about the monitors such as their status and history.
## Prerequisites
* [Create an Axiom account](https://app.axiom.co/register).
* [Create an empty dashboard](/dashboards/create).
{/* list separator */}
* [Create a monitor](/monitor-data/monitors).
## Create monitor list
1. Go to the Dashboards tab and open the dashboard to which you want to add the monitor list.
2. Click  **Add element** in the top right corner.
3. Click **Monitor list** from the list.
4. In **Columns**, select the type of information you want to display for each monitor:
* **Status** displays if the monitor state is normal, triggered, or disabled.
* **History** provides a visual overview of the recent runs of the monitor. Green squares mean normal operation and red squares mean triggered state.
* **Dataset** is the name of the dataset on which the monitor operates.
* **Type** is the type of the monitor.
* **Notifiers** displays the notifiers connected to the monitor.
5. From the list, select the monitors you want to display on the dashboard.
6. Click **Save**.
The new element appears in your dashboard. At the bottom, click **Save** to save your changes to the dashboard.
**Add element** in the top right corner.
3. Click **Monitor list** from the list.
4. In **Columns**, select the type of information you want to display for each monitor:
* **Status** displays if the monitor state is normal, triggered, or disabled.
* **History** provides a visual overview of the recent runs of the monitor. Green squares mean normal operation and red squares mean triggered state.
* **Dataset** is the name of the dataset on which the monitor operates.
* **Type** is the type of the monitor.
* **Notifiers** displays the notifiers connected to the monitor.
5. From the list, select the monitors you want to display on the dashboard.
6. Click **Save**.
The new element appears in your dashboard. At the bottom, click **Save** to save your changes to the dashboard.