> ## Documentation Index
> Fetch the complete documentation index at: https://axiom-mano-sample-app.mintlify.site/llms.txt
> Use this file to discover all available pages before exploring further.
# Dashboards
> This section introduces the Dashboards tab and explains how to create your first dashboard.
Dashboards provide a single view into your data.
Axiom provides a mature dashboards experience that allows you to visualize collections of queries across multiple datasets in one place.
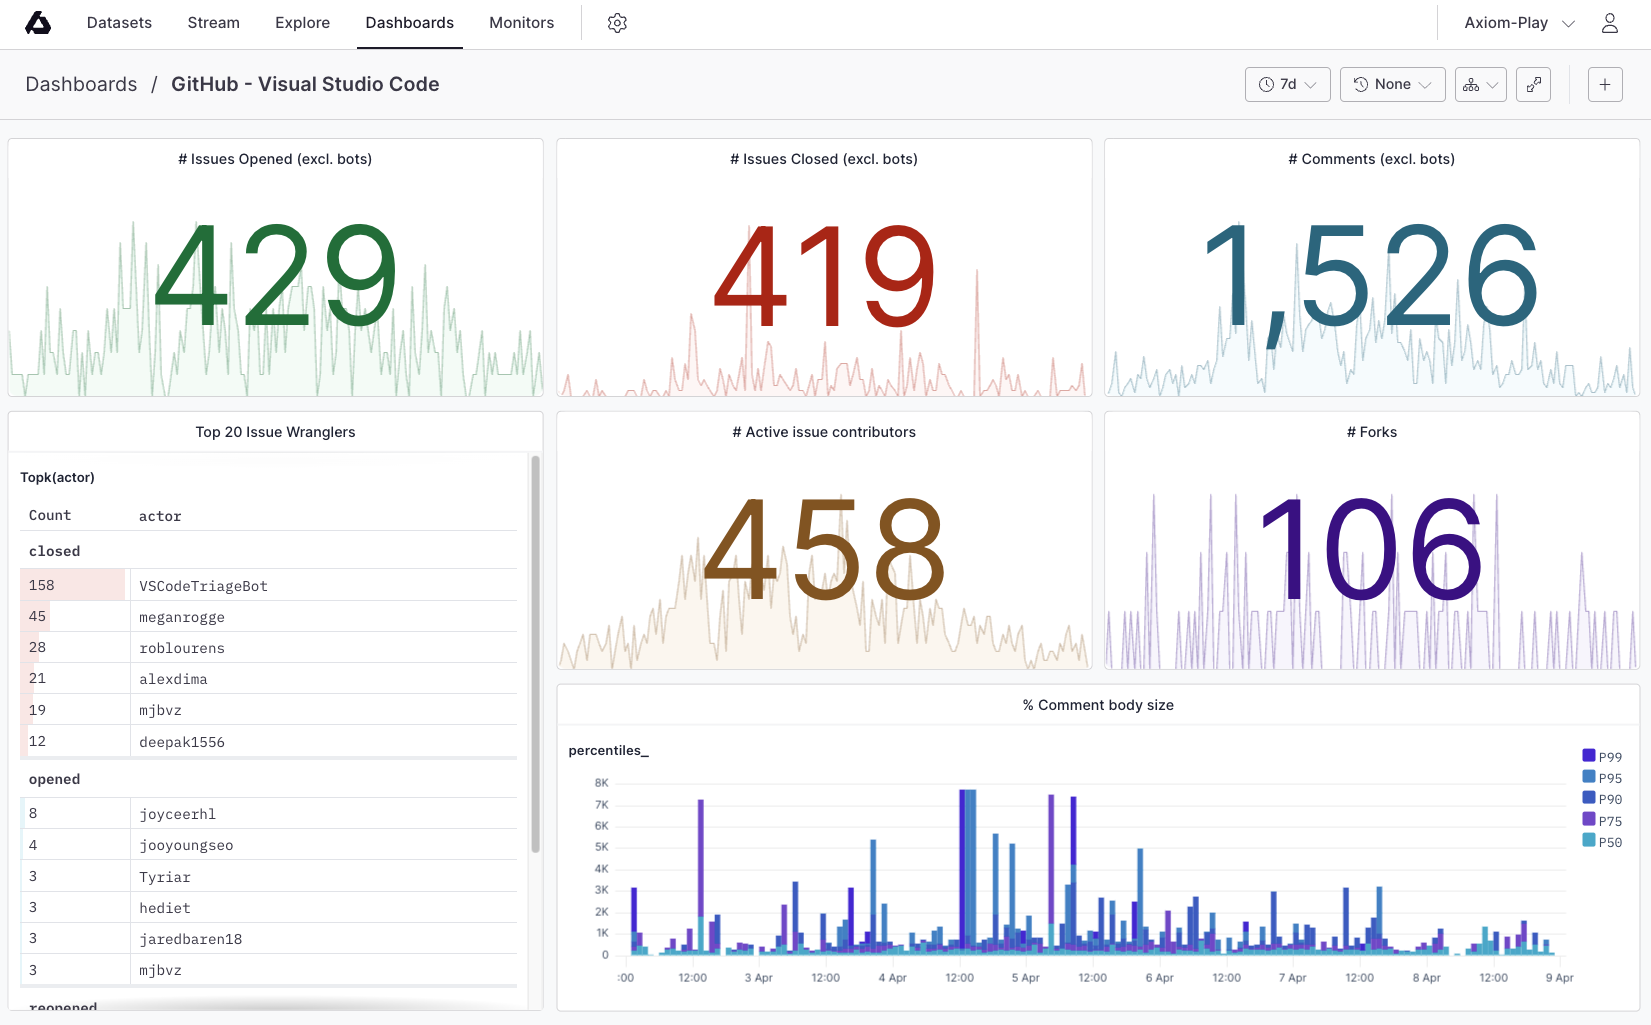 Dashboards are easy to share, benefit from collaboration, and bring separate datasets together in a single view.
## Dashboards tab
The Dashboards tab lists the dashboards you have access to.
* The **Integrations** section lists prebuilt dashboards. Axiom automatically built these dashboards as part of the [apps that enrich your Axiom experience](/apps/introduction). The integration dashboards are read-only and you cannot edit them. To create a copy of an integration dashboard that you can edit, [fork the original dashboard](/dashboards/configure#fork-dashboards).
* The sections below list the private and shared dashboards you can access.
To open a dashboard, click a dashboard in the list.
## Work with dashboards
Dashboards are easy to share, benefit from collaboration, and bring separate datasets together in a single view.
## Dashboards tab
The Dashboards tab lists the dashboards you have access to.
* The **Integrations** section lists prebuilt dashboards. Axiom automatically built these dashboards as part of the [apps that enrich your Axiom experience](/apps/introduction). The integration dashboards are read-only and you cannot edit them. To create a copy of an integration dashboard that you can edit, [fork the original dashboard](/dashboards/configure#fork-dashboards).
* The sections below list the private and shared dashboards you can access.
To open a dashboard, click a dashboard in the list.
## Work with dashboards