This section explains how to create statistic dashboard elements and add them to your dashboard.
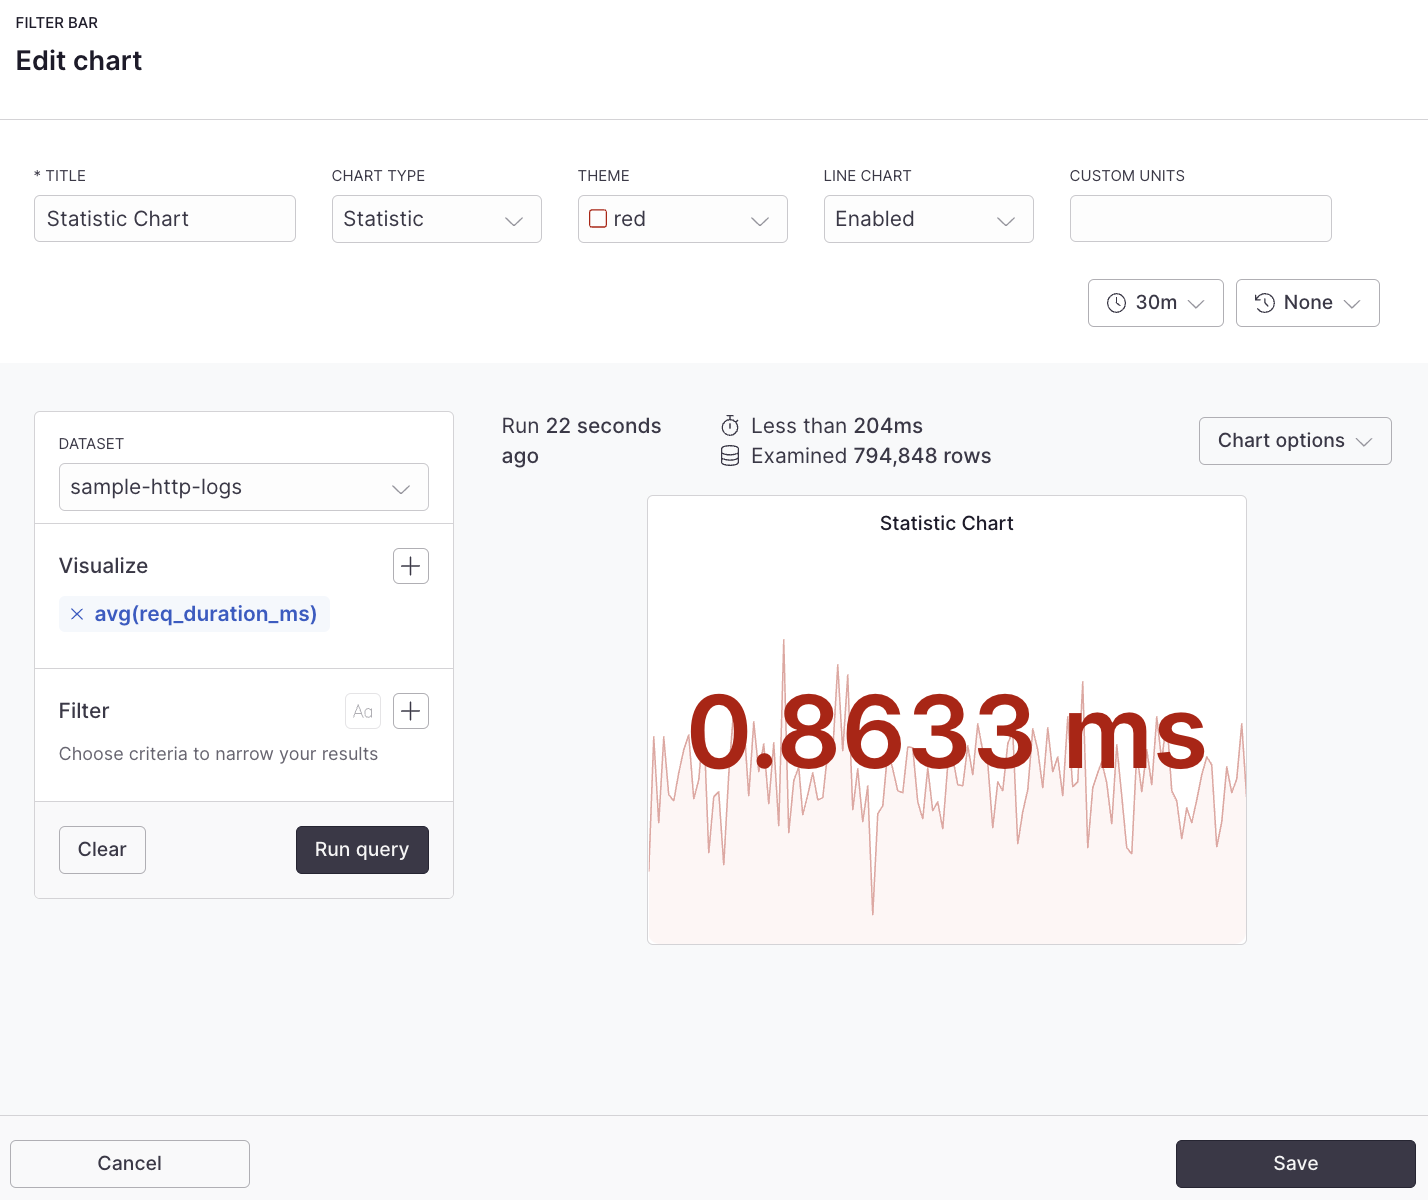
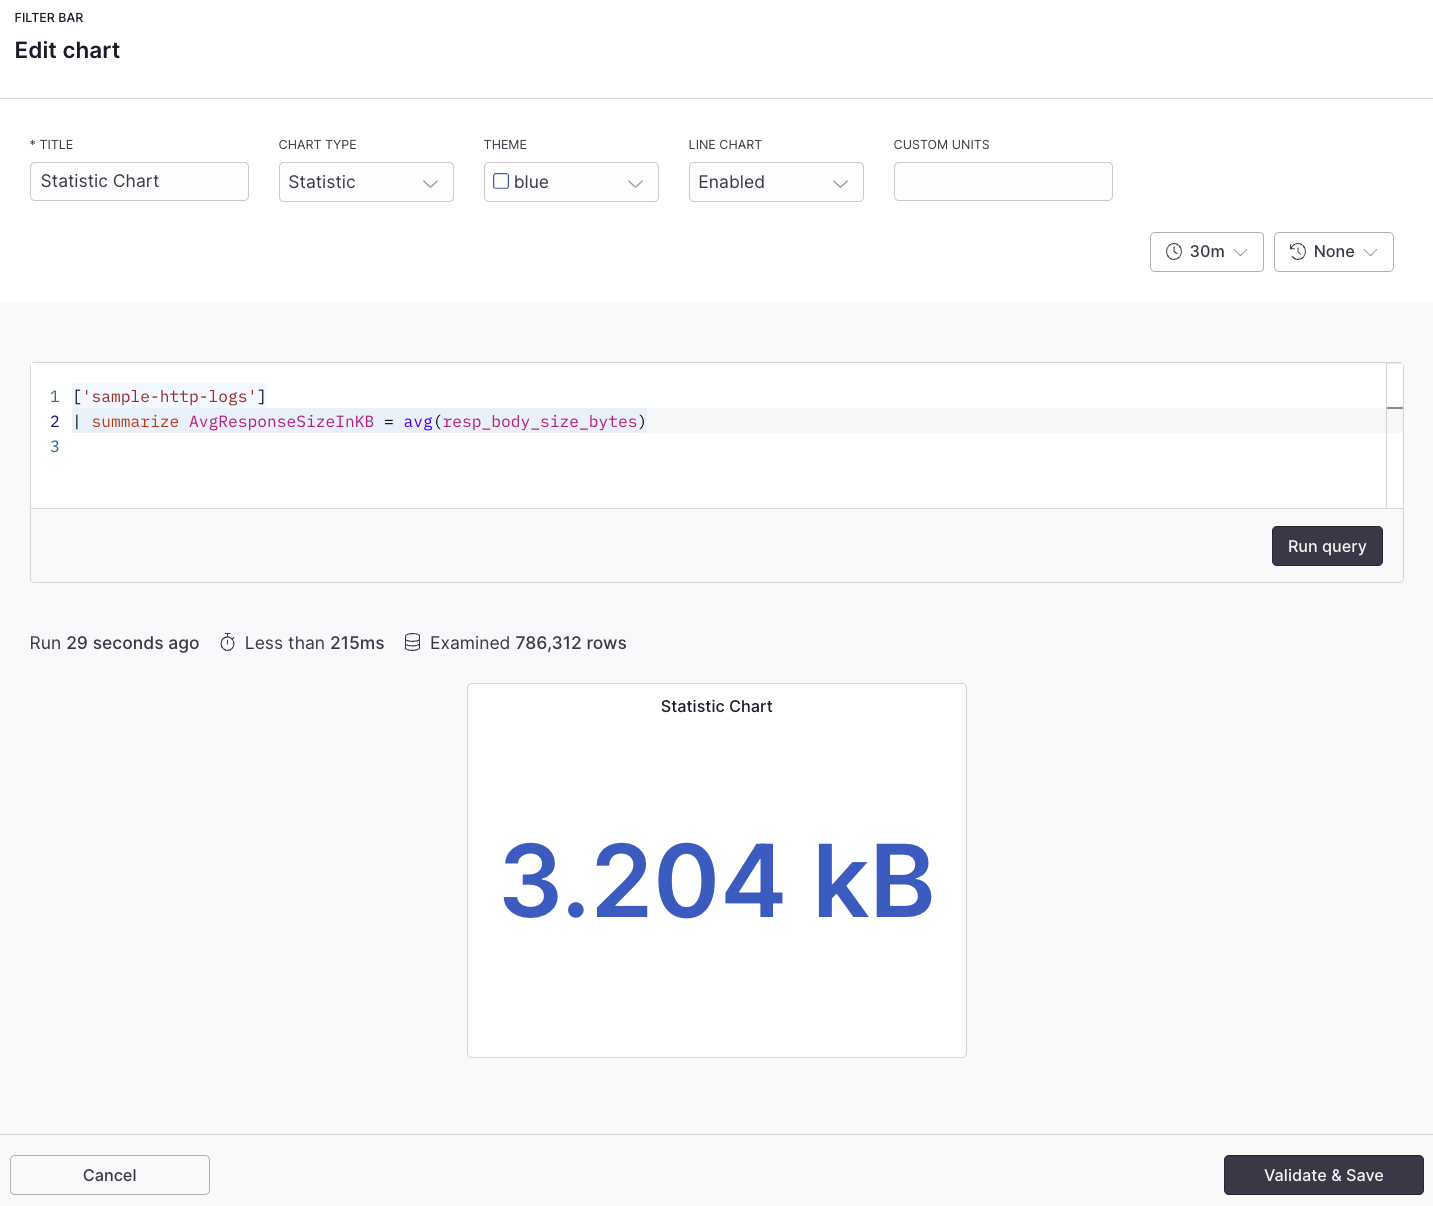
Statistics dashboard elements display a summary of the selected metrics over a given time period. For example, you can use a statistic dashboard element to show the average, sum, min, max, and count of response times or error counts.