The table dashboard element displays a summary of any attributes from your metrics, logs, or traces in a sortable table format. Each row in the table could represent a different service, host, or other entity, with columns showing various attributes or metrics for that entity.Documentation Index
Fetch the complete documentation index at: https://axiom-mano-sample-app.mintlify.app/llms.txt
Use this file to discover all available pages before exploring further.
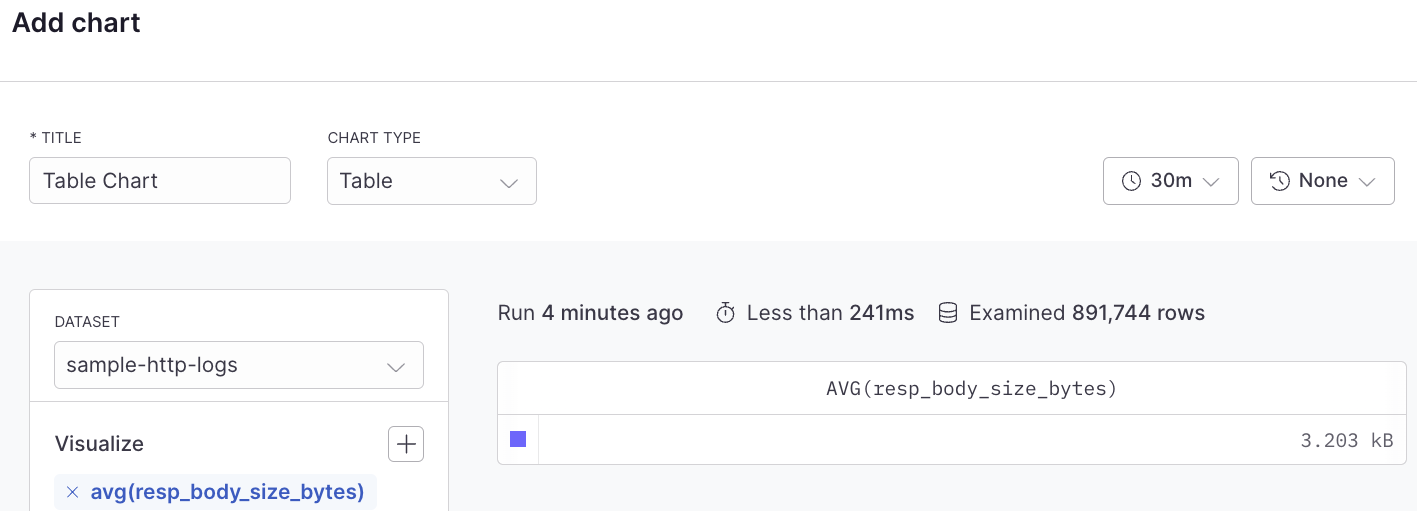
Example with Simple Query Builder

Example with Advanced Query Language
With this option, the table chart type has the capability to display a non-aggregated view of events.
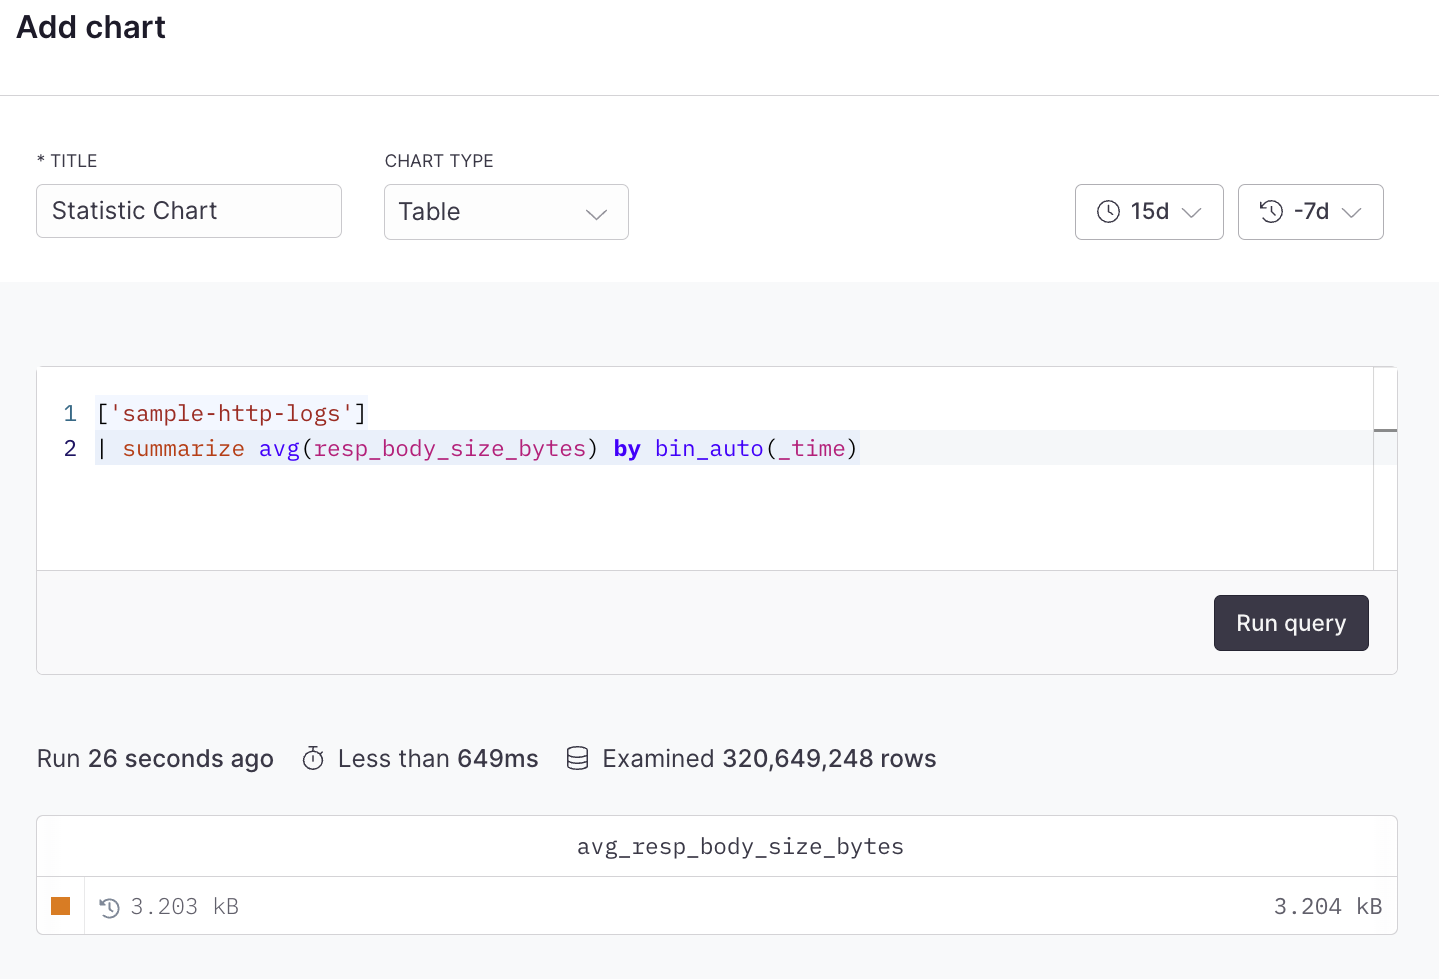